Metrics
Metrics in viaSocket are measurements that track the performance of your workflows. They provide important data on how well your workflows are running, helping you identify areas for improvement. Metrics help you monitor things like execution time, success rates, and errors.

Flow Wise & Step Wise Metrics
Metrics provide quantitative data about how well your workflows are performing. They track parameters such as execution time and status for each and every step of a workflow, allowing you to assess the efficiency of your automation processes.
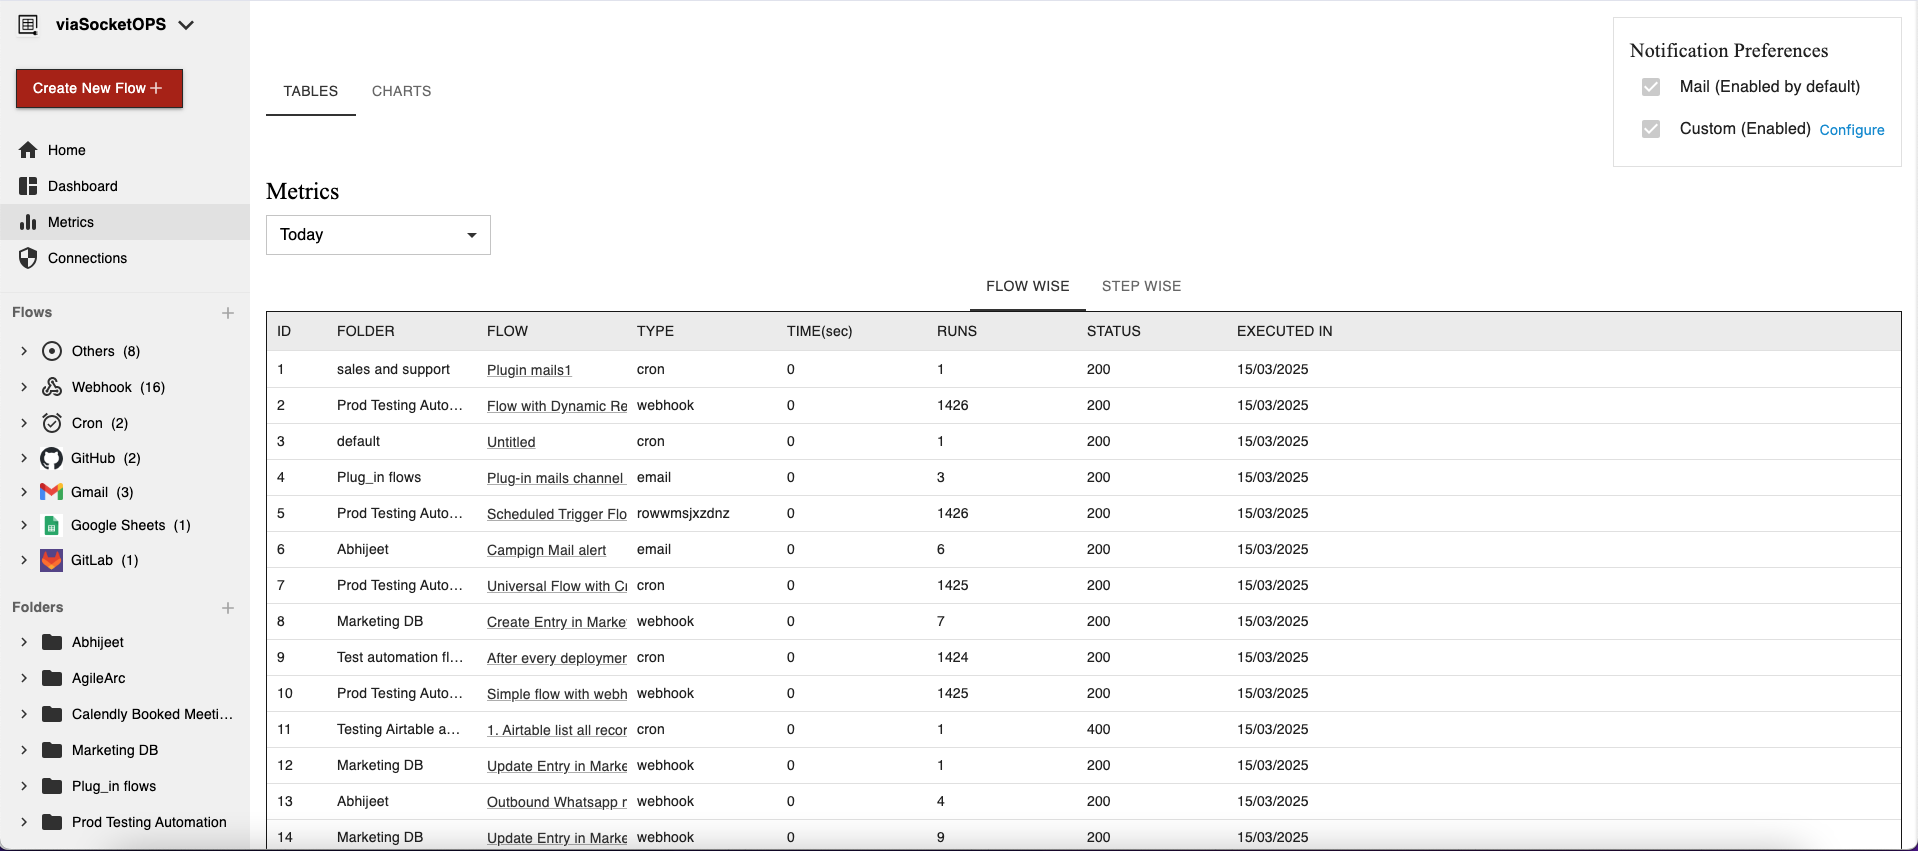
Flow Wise Metrics
Flow Wise metrics give you an overview of the performance of the entire workflow. They show you the combined data for all steps within a flow, helping you track:
Overall execution time for the entire workflow.
Success rate and error rate for the whole flow.
These metrics give you a broad picture of how your workflow is performing.
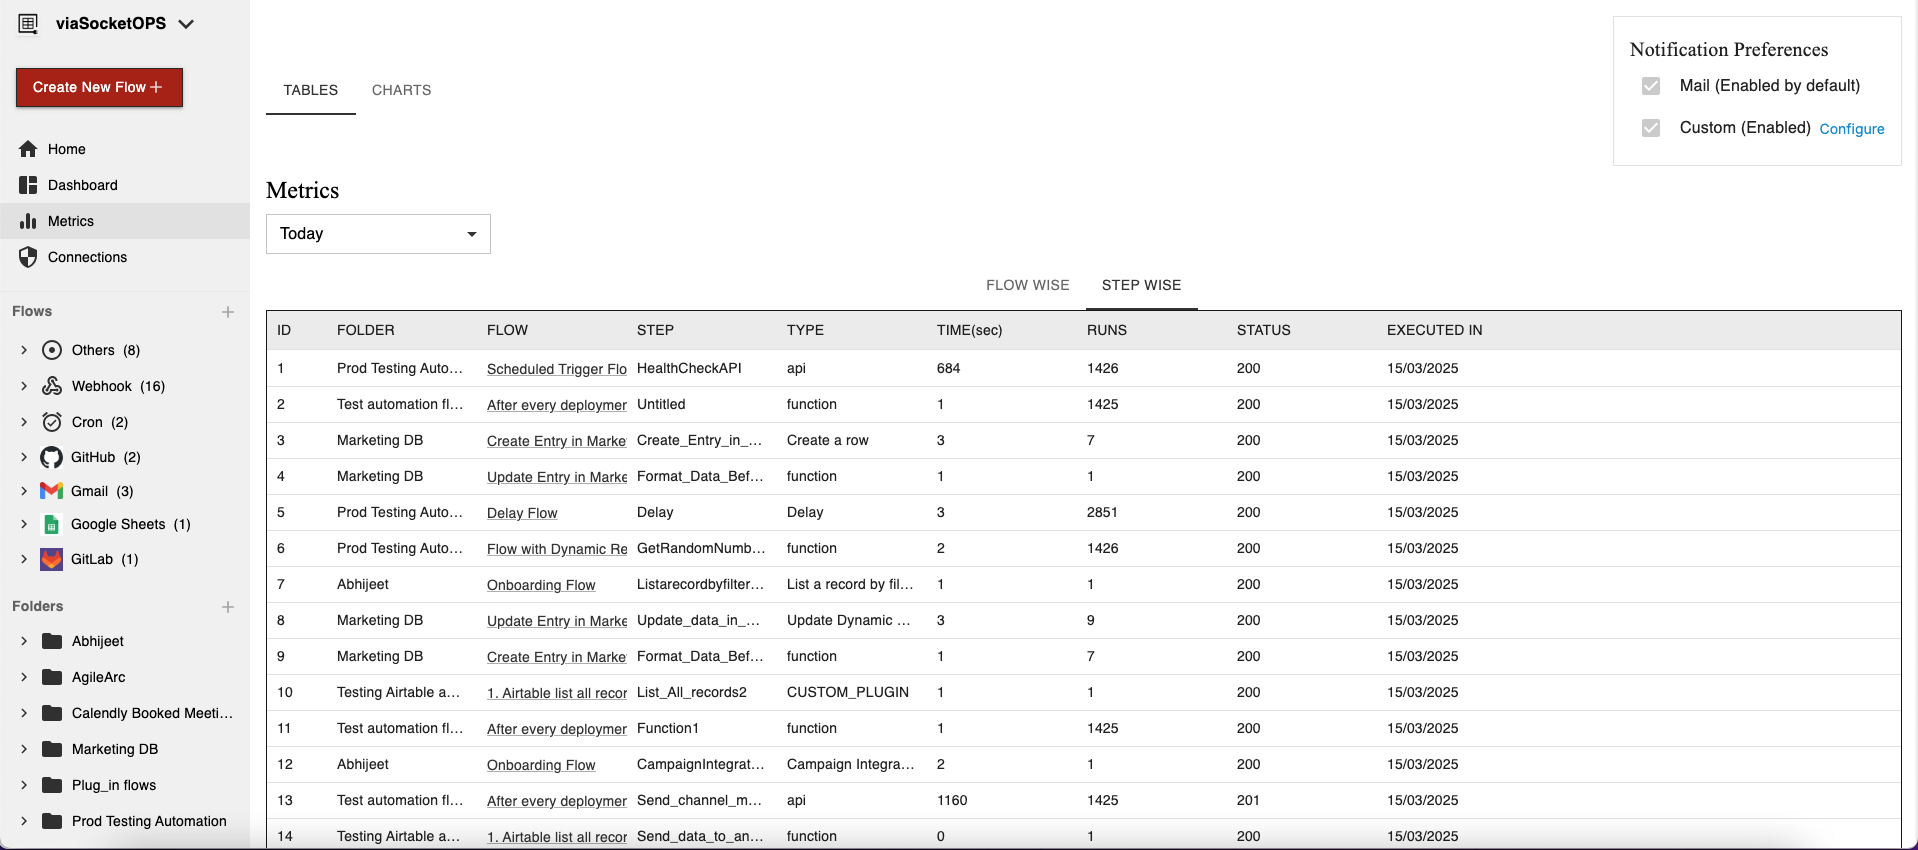
Stepwise Metrics
Stepwise metrics focus on the performance of individual steps within your workflow. This allows you to see:
Execution time for each specific step.
Error rate or success rate for each step.
Stepwise metrics help you pinpoint which specific steps are performing well and which might need improvement.
Viewing Metrics in viaSocket
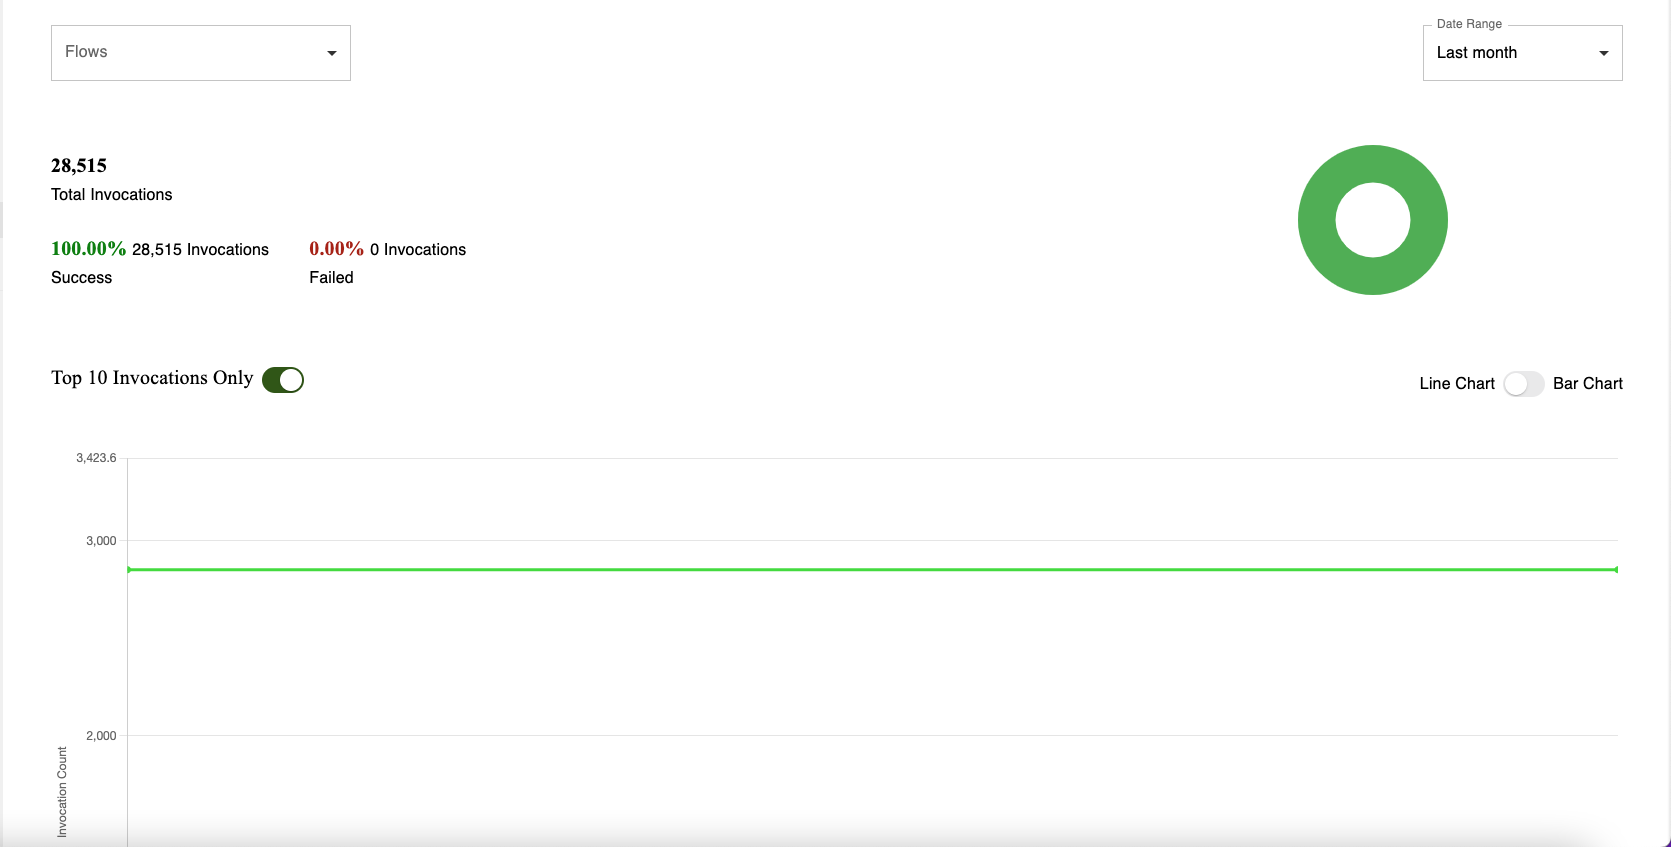
viaSocket presents these metrics in chart form, which makes it easy to visualise the data. You can view:
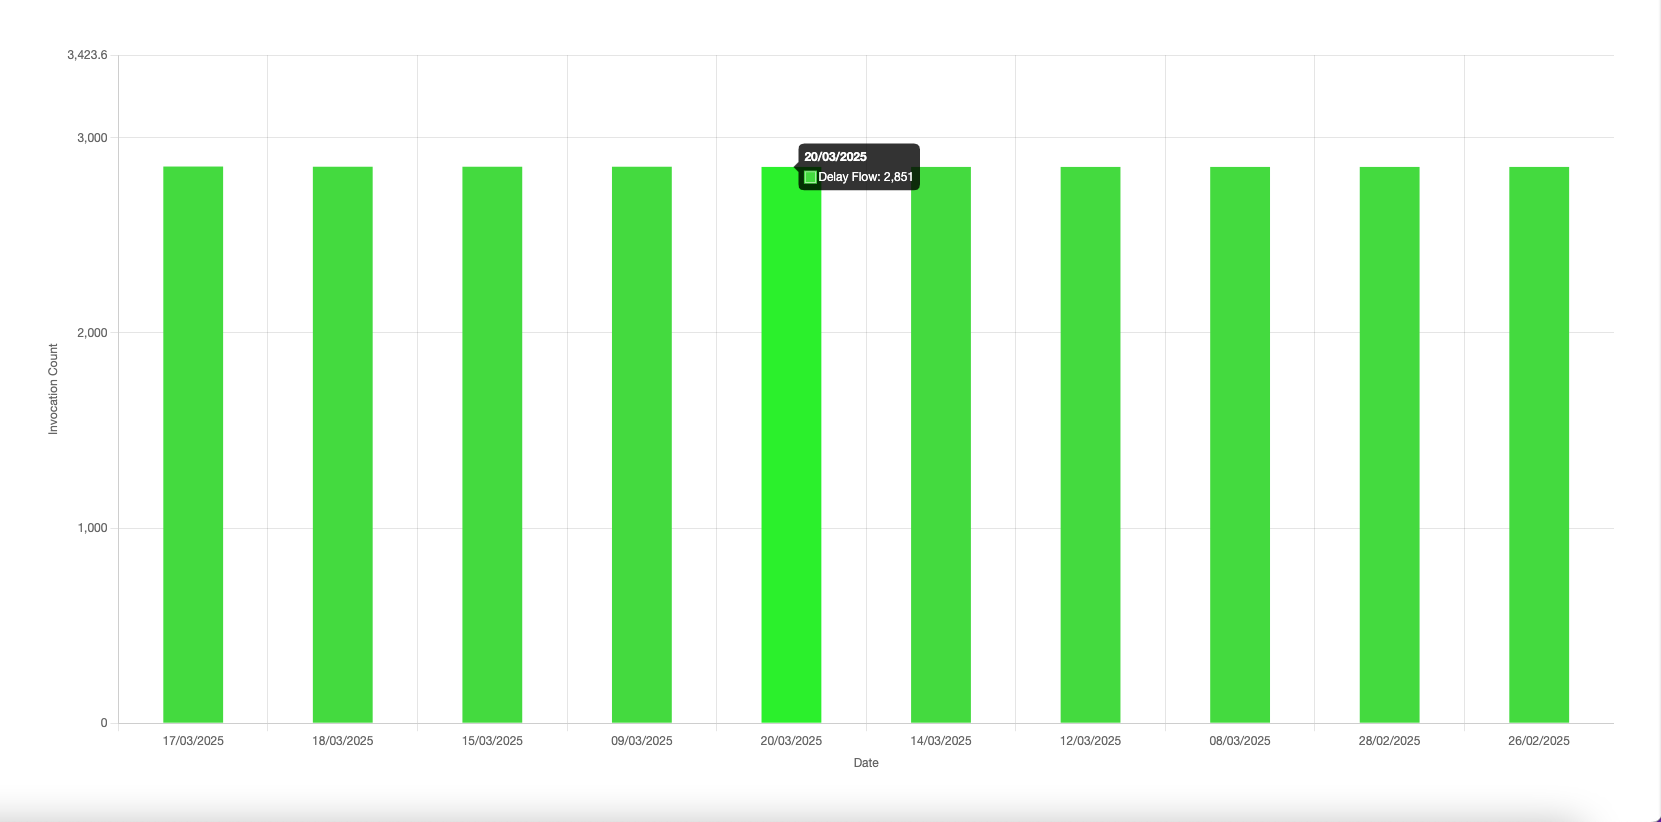
Bar charts to compare the performance of different workflows or steps.
Line charts to track performance over time (like changes in success rate or execution time.